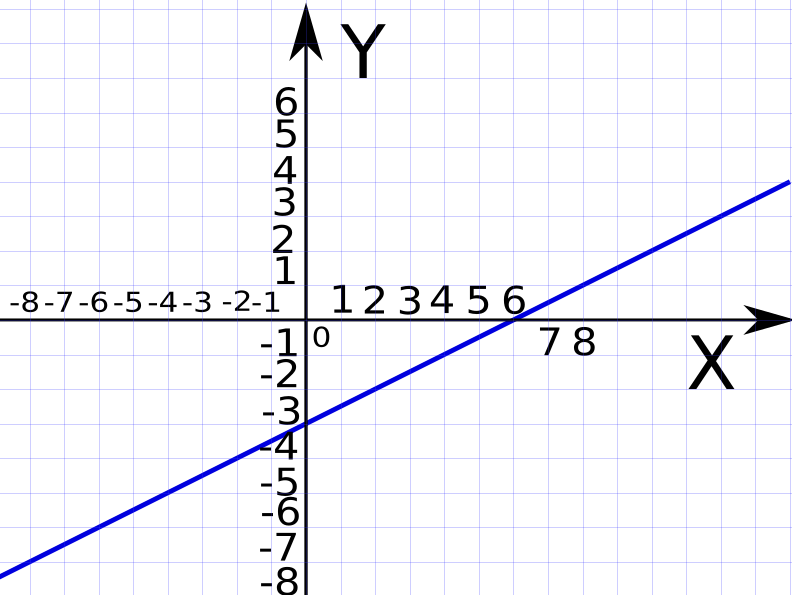
In the image above the Y-values are printed so the bottom of the figure touches the line where the value is. With each square the value increases 1.0. This type of chart is also called graph. The vertical line with an arrow on top of it is called the Y-axis. The horizontal line with an arrow on the right-hand side of it is called the X-axis. The point where the Y-axis and the X-axis crosses each other (intersects) is called the "Origin". The coordinates of the origin is always (0,0). The coordinates of a certain point in the chart is the value of respectively the X-axis and the Y-axis of that point. As you can see the blue line intersects the Y-axis three squares below the origin. The coordinates of this point is (0, -3). X is -3 and Y is 0 in this point. The blue line also intersects the X-axis in the point (6, 0) where x is 6 and y is 0. You can get the X-coordinate of a random point by drawing a vertical line from the point towards the X-axis. Where it crosses the x-axis is the x-value. Similarly you can obtain the y-coordinate by drawing a horizontal line towards the y-axis. Where it crosses the y-axis is the y-value. On one side of the origin the values are positive, denoted by no sign or a plus sign. On the other side of the origin the values are negative, denoted by a minus sign.
This is the slope-intercept form: y = ax + b
The values of x and y varies while the values of a and b are always the same. Therefore x and y are called variables. "b" is called a constant while "a" is
called a coefficient since you multiply it by the variable x. "a" and "b" never varies. In order to calculate the coefficients of the slope-intercept form we have
to determine which values the constant "b" and the coefficient "a" should have.
If you look at the chart above you can notice the following when studying the blue line:
Every time the blue line moves two squares to the right it also moves one square upwards.
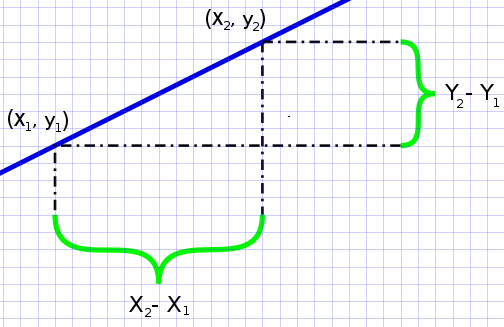
"A" describes the slope of the line and b says where it crosses the y-axis. To determine the coefficient "a" you can take any two points along the blue line you want, as long as it passes through them. Previously I mentioned the point (0, -3), where x is 0 and y is -3. I also mentioned the point (6, 0), where x is 6 and y has the value 0. Let's use these two points to try to calculate the coefficient "a".

Use the following formula when calculating "a":
The subscript (the symbol just after and below) 1 just means the first. The subscript 2 means the second. Hence the point (x1, y1) is in our case (0, -3). The point (x2, y2) is in our case (6, 0). Now we replace the coordinates for our points with our values. The formula becomes:
Simplifying this yields:
Which is the same as:
To determine b set the value of x to zero:
Which is the same as:
The blue line crosses the y-axis at the point where y is -3. And if y is -3, then b must be -3.
So our slope-intercept form in this case becomes:
or:
It's better to get used to using the latter form. Usually the coefficient "a" is something like and you will never be able to write them exactly. 0.66666666667 is only an approximation.